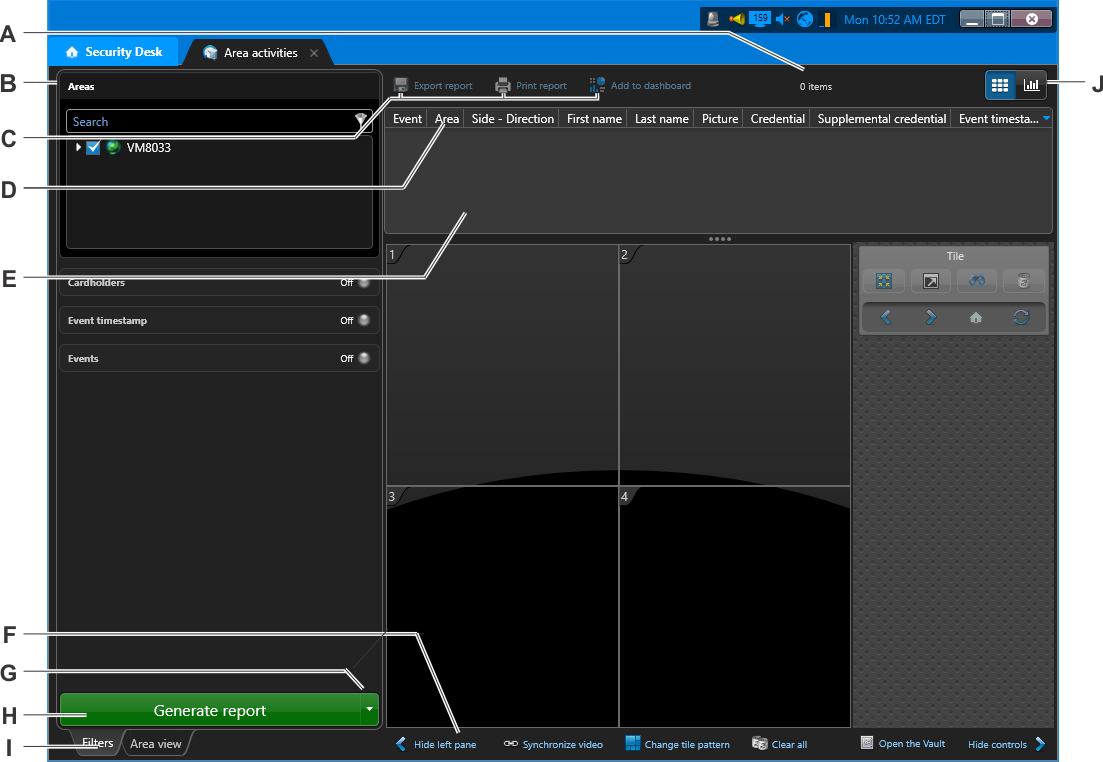

Reporting tasks are where you generate customized queries about the entities, activities, and events in your Security Center system for investigation or maintenance purposes. Most investigation and maintenance tasks are reporting tasks.
This section takes you on a tour of the reporting task layout, and describes the common elements of most reporting tasks. The Area activities task was used as an example. You can open the Area activities task by typing its name in the Search box on the home page.

| A | Number of results | Displays the number of returned results. A warning is issued when your query returns too many rows. If this happens, adjust your query filters to reduce the number of results. |
| B | Query filters | Use the filters in the
Filters
tab to set up your query. Click on a filter heading to turn it on ( |
| C | Export, print, or add to dashboard | Click to export your generated report, print it, or add the report to a dashboard. |
| D | Select columns | Right-click a column heading to select which columns to display in the report pane. |
| E | Report pane | View the results of your report. Drag an item from the list to a tile in the canvas, or right-click an item in the list to view more options associated with that item, if applicable (such as launching another report related that report result). |
| F | Tile commands | Commands related to canvas tiles:
|
| G | Generate and save report | Click to run and save the report directly to a file (PDF, CSV, or Excel format). This button is disabled if you have not selected any query filters, or when you have invalid filters. |
| H | Generate report | Click to run the report. This button is disabled if you have not selected any query filters, or when you have invalid filters. While the query is running, the button changes to Cancel. Click on Cancel to interrupt the query. |
| I | Filters tab |
Use the Filters tab to customize and filter your searches. The Filters tab only appears in reporting tasks.
NOTE: Click the Area view tab to show
the area view, and select entities to view in the canvas.
|
| J | Tiles or Charts | If the report supports tiles, open the chart view using the toggle button
(
|