When Security Desk operators need to monitor a large geographic area with many entities, creating a drill-down view can make it easier for the operator to manage the area. This can be especially useful when managing parking zones.
What you should know
To configure a map drill-down:
-
In Config
Tool, open the Area view task and create the areas needed for the drill-down.
This example uses the following areas:
Airport parking (added as an Area entity)
Multi-level parking lot (added as an Area entity)
Parking level 3 (added as an Parking zone entity)
Parking level 2 (added as an Parking zone entity)
Parking level 1 (added as an Parking zone entity)
-
To add maps to the areas, in the Identity tab for each of the areas, click Create map and add a map of the area.
This example uses the following area maps:
-
Create map links to drill down through the areas. For this example, we are drilling down from the airport parking map, to the multi-level parking map, to the parking level map.
- In the Map designer task, open the Airport parking map.
-
Using the Vector tools, draw a polygon over the multi-level parking lot.
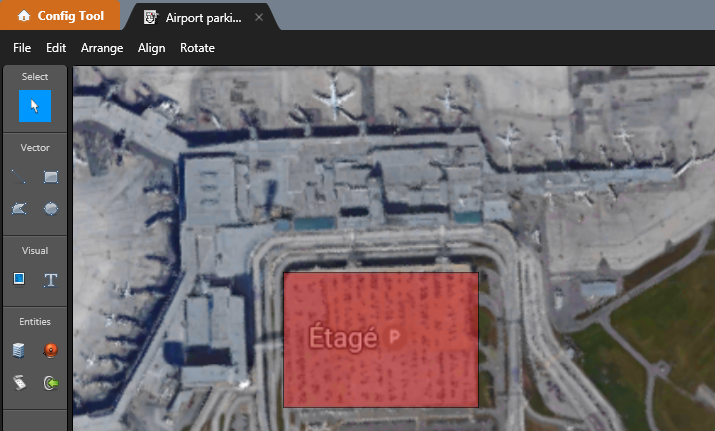
-
From the Links widget, assign the multi-level parking lot area to the polygon.
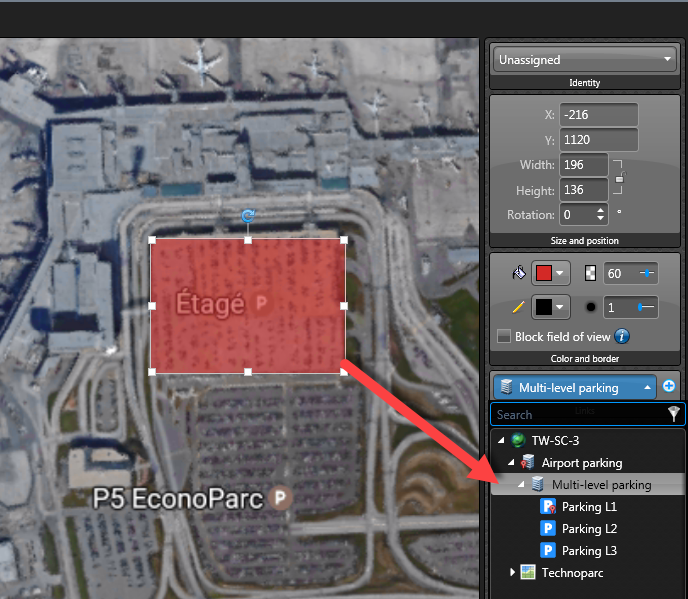 NOTE: You can select a color for the polygon from the Color and border widget.
 -
To display the occupancy of each parking zone on the map, in the toolbar, click Area view (
 ), and drag each of the parking zones onto the map. The parking zones appear as polygons on the map. You can select a color for each polygon and use the Add text (
 ) tool to identify the parking zone.
-
In the Map designer toolbar, click
Save (
 ).
).
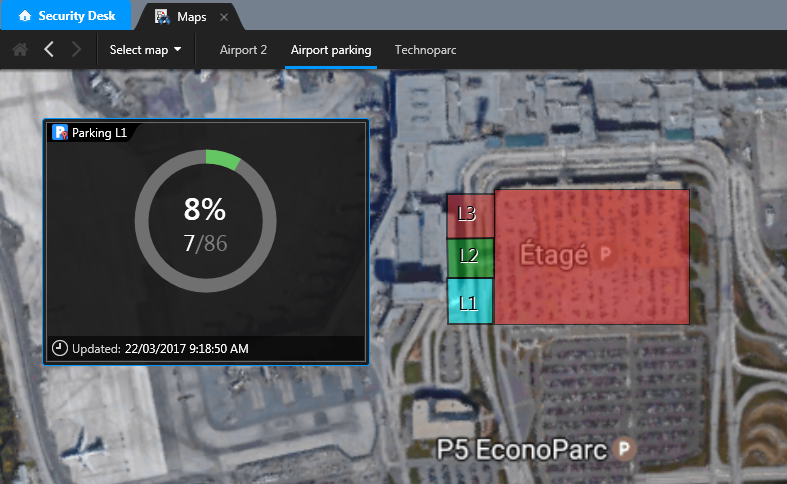 When this map is displayed in Security Desk, clicking one of the parking zone polygons displays the parking zone occupancy. Clicking the multi-level parking lot polygon drills down to the multi-level parking lot map.
 - In the Map designer task, open the multi-level parking map.
-
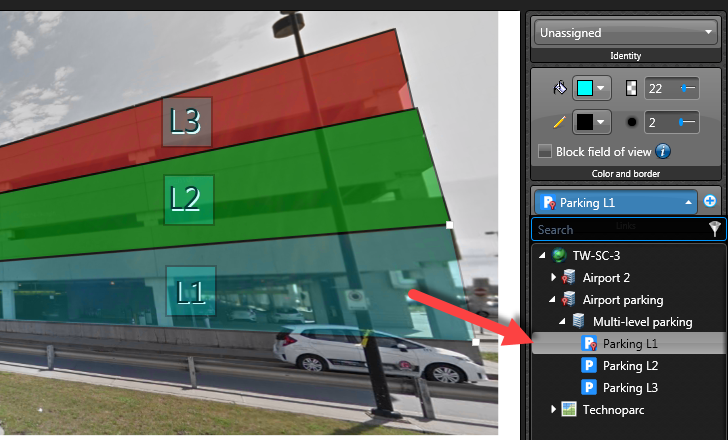
Using the Vector tools, draw a polygon over each level of the parking lot.
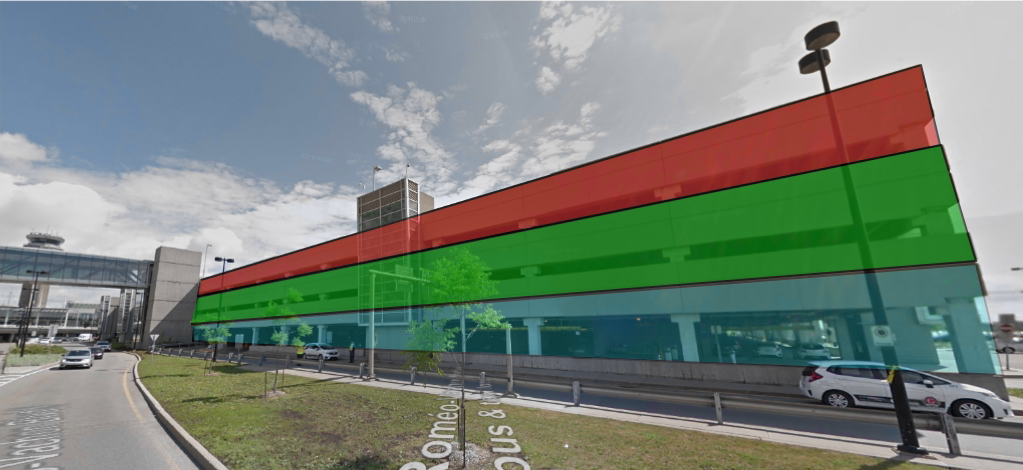
-
From the Links widget, assign the parking zone that corresponds to each polygon.
-
To display the occupancy of each parking zone on the map, in the toolbar, drag each of the parking zones onto the map from the Area view
 as you did for the first map.
-
In the Map designer toolbar, click
Save (
 ).
).
-
In the Map designer task, open the Parking level 1 map.
NOTE: It is not necessary to link polygons to any additional maps because for this example, the parking zone is the lowest level of this drill-down.
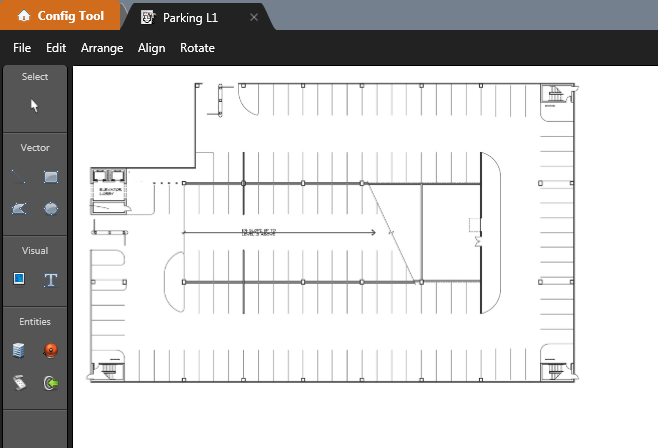
-
To add a Sharp video unit that is monitoring the parking zone, click Area view (
 ), and drag the Sharp onto the map.
- If you want to display license plate reads, drag in the Sharp unit.
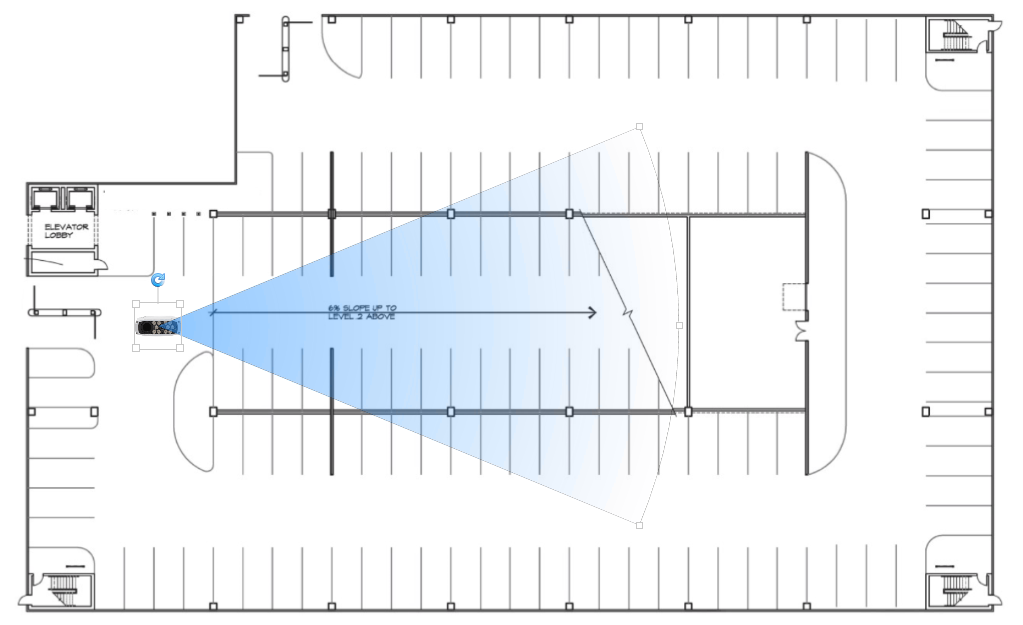
- If you want to display a representation of the Sharp's field of view, drag in the LPR camera that is listed under the Sharp unit, as shown in the following image. Select Show field of view from the Field of view widget.
-
In the Map designer toolbar, click
Save (
 ).
).
